

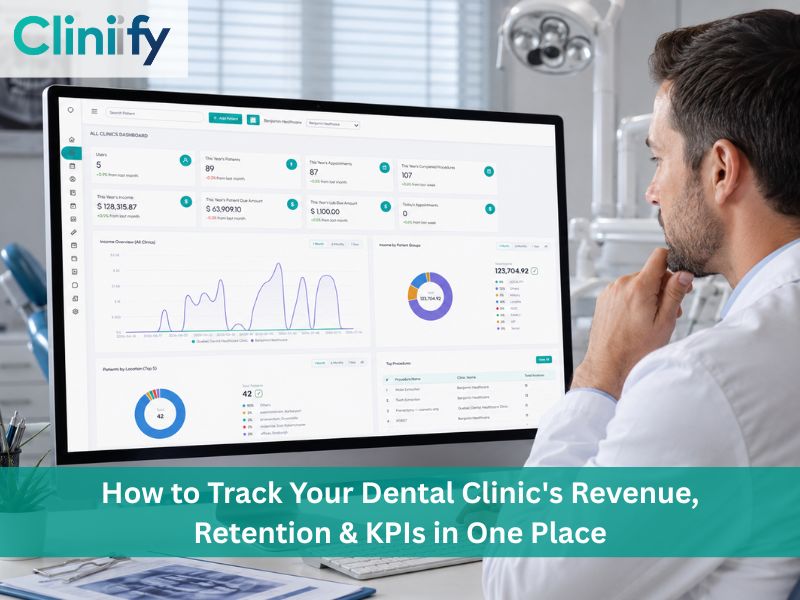
How to Track Dental Clinic Revenue, Retention & KPIs | Cliniify
Running a dental clinic without tracking your KPIs is like performing a root canal without an X-ray—you’re working blind.
Many Canadian dental clinic owners still rely on multiple disconnected systems to understand how their practice is performing. Revenue is checked in accounting software, appointments are monitored in a scheduling tool, patient recalls are tracked in spreadsheets, and staff performance often isn't tracked at all. The result? Revenue leaks go unnoticed, patient retention gradually declines, and growth opportunities are missed.
The good news is that it doesn't have to be this way.
In this guide, you'll learn the most important KPIs every Canadian dental clinic should monitor, the industry benchmarks to aim for in 2026, and how Cliniify, an AI-powered dental clinic KPI tracking software Canada, helps you track every important metric from one centralized dashboard.
Why KPI Tracking Matters More Than Ever for Canadian Dental Clinics
The Canadian dental industry has changed dramatically over the past few years. With more than 6.5 million Canadians now eligible under the Canadian Dental Care Plan (CDCP), clinics are managing higher patient volumes, more complex insurance workflows, and increasing administrative responsibilities.
At the same time, competition is increasing.
According to the 2026 Planet DDS Dental Industry Report, the revenue difference between average-performing and top-performing dental practices exceeds $68,000 per chair annually. For a clinic with ten operatories, that represents nearly $680,000 in unrealized revenue without adding more staff or expanding the practice.
The biggest difference isn't clinical expertise—it's visibility into business performance.
Successful clinics consistently monitor their key performance indicators (KPIs), review reports weekly, and make decisions based on real-time data instead of assumptions.
Canadian dental clinics that actively track KPIs significantly outperform those that don't. According to the 2026 Planet DDS Dental Industry Report, the performance gap between average and top-performing practices exceeds $68,000 per chair annually. For a 10-operatory clinic, that's up to $680,000 in unrealized revenue — with no additional overhead required.
The 7 KPIs Every Canadian Dental Clinic Must Track
1. Collection Rate
Benchmark: 98% or higher
Your collection rate measures how much of what you produce you actually collect. A rate below 98% signals billing inefficiencies, insurance claim errors, or gaps in your CDCP pre-authorization process. This is often the single biggest source of silent revenue loss in Canadian clinics.
2. Case Acceptance Rate
Benchmark: 50–60% average; 75%+ for top performers
This measures how many patients say yes to the treatment you recommend. The average Canadian dental practice accepts just 45% of presented treatment plans — meaning more than half of clinical opportunities walk out the door. Top-performing practices hit 75% or above by presenting treatment visually, clearly, and with easy payment options upfront.
3. Patient Retention Rate
Benchmark: 85%+
Retention measures how many existing patients keep coming back. A healthy retention rate reduces your dependence on costly new patient acquisition. It's also a direct reflection of your patient experience — how easy it is to book, how reliably you follow up, and how well your recall system works.
4. New Patients Per Month
Benchmark: 20+ per month per provider
New patient volume is your growth engine. But it must be paired with retention — otherwise you're filling a leaky bucket. Track this alongside your Patient Acquisition Cost (PAC) to understand what you're spending to bring each new patient through the door.
5. No-Show & Cancellation Rate
Benchmark: Under 8%
Every empty chair is lost revenue. A no-show rate above 8% is a scheduling and communication problem — one that automated reminders and smart scheduling can largely solve. Even reducing your no-show rate by 3–4% can add tens of thousands of dollars to your annual revenue.
6. Revenue Per Chair Per Day
Benchmark: $1,200–$1,800/chair/day for general dentistry
This KPI cuts through the noise and tells you how efficiently each operatory is generating revenue. Tracking this helps you identify underperforming time blocks, underused chairs, and scheduling gaps that are costing you money.
7. Hygiene Recall Effectiveness
Benchmark: 85%+ reappointment rate
Hygiene drives the recurring revenue backbone of most clinics. Knowing what percentage of patients are reappointed before they leave the chair — and what percentage are successfully recalled — tells you how well your team is building long-term patient relationships.
The Problem: Most Clinics Track These KPIs Across 4–5 Disconnected Tools
Here's the reality for most dental clinic owners in Canada:
- Revenue data lives in QuickBooks or their accounting software
- Appointment and no-show data is in their scheduling tool
- Patient recall is tracked (loosely) in a spreadsheet
- CDCP billing status is somewhere in their insurance portal
- Team performance is… not tracked at all
Every time you want a clear picture of your clinic's health, someone has to manually pull data from multiple places, reconcile numbers, and build a report — usually taking hours that could be spent on patients.
This fragmentation is exactly where clinics lose money without realizing it.
How Cliniify Solves This
Cliniify eliminates disconnected reporting by bringing every important metric into one centralized dashboard.
Built specifically for Canadian dental practices, Cliniify combines clinical operations, scheduling, billing, reporting, and dental revenue tracking into a single platform.
Whether you operate one clinic or multiple locations, every KPI is available in real time.
Single Clinic Dashboard
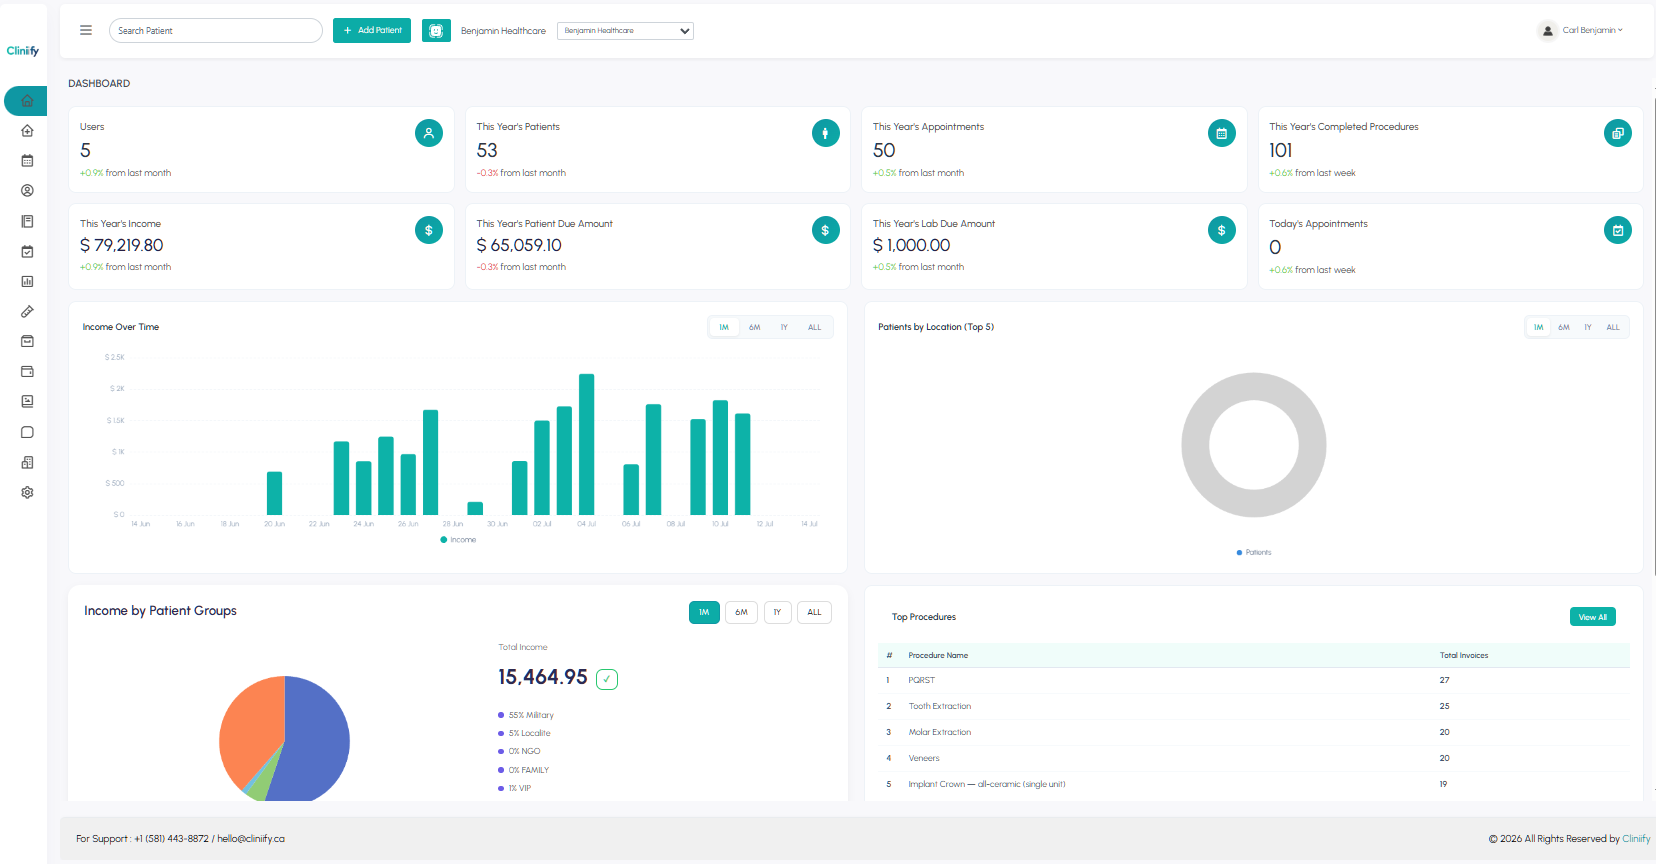
For independent clinic owners, Cliniify's single-clinic dashboard gives you a real-time snapshot of everything that matters:
- This Year's Income — track total revenue collected (e.g., $79,219.80) with month-over-month trend
- This Year's Patients & Appointments — see active patient volume and appointment count at a glance
- Patient Due Amount — outstanding balances surfaced immediately so nothing slips through billing
- Lab Due Amount — track what's owed to labs separately from patient billing
- Today's Appointments — daily schedule visibility right on the home screen
- Income Over Time — bar chart showing revenue trends by date range (1M / 6M / 1Y / All)
- Income by Patient Groups — pie chart breakdown by patient category (Military, Locale, VIP, NGO, Family) so you know which segments drive your revenue
- Patients by Location (Top 5) — understand where your patients are coming from geographically
- Top Procedures — ranked list of your highest-volume procedures by total invoices (e.g., Tooth Extraction, Veneers, Implant Crown)
Everything updates in real time. No exports. No manual reconciliation.
Multi-Clinic / All Clinics Dashboard
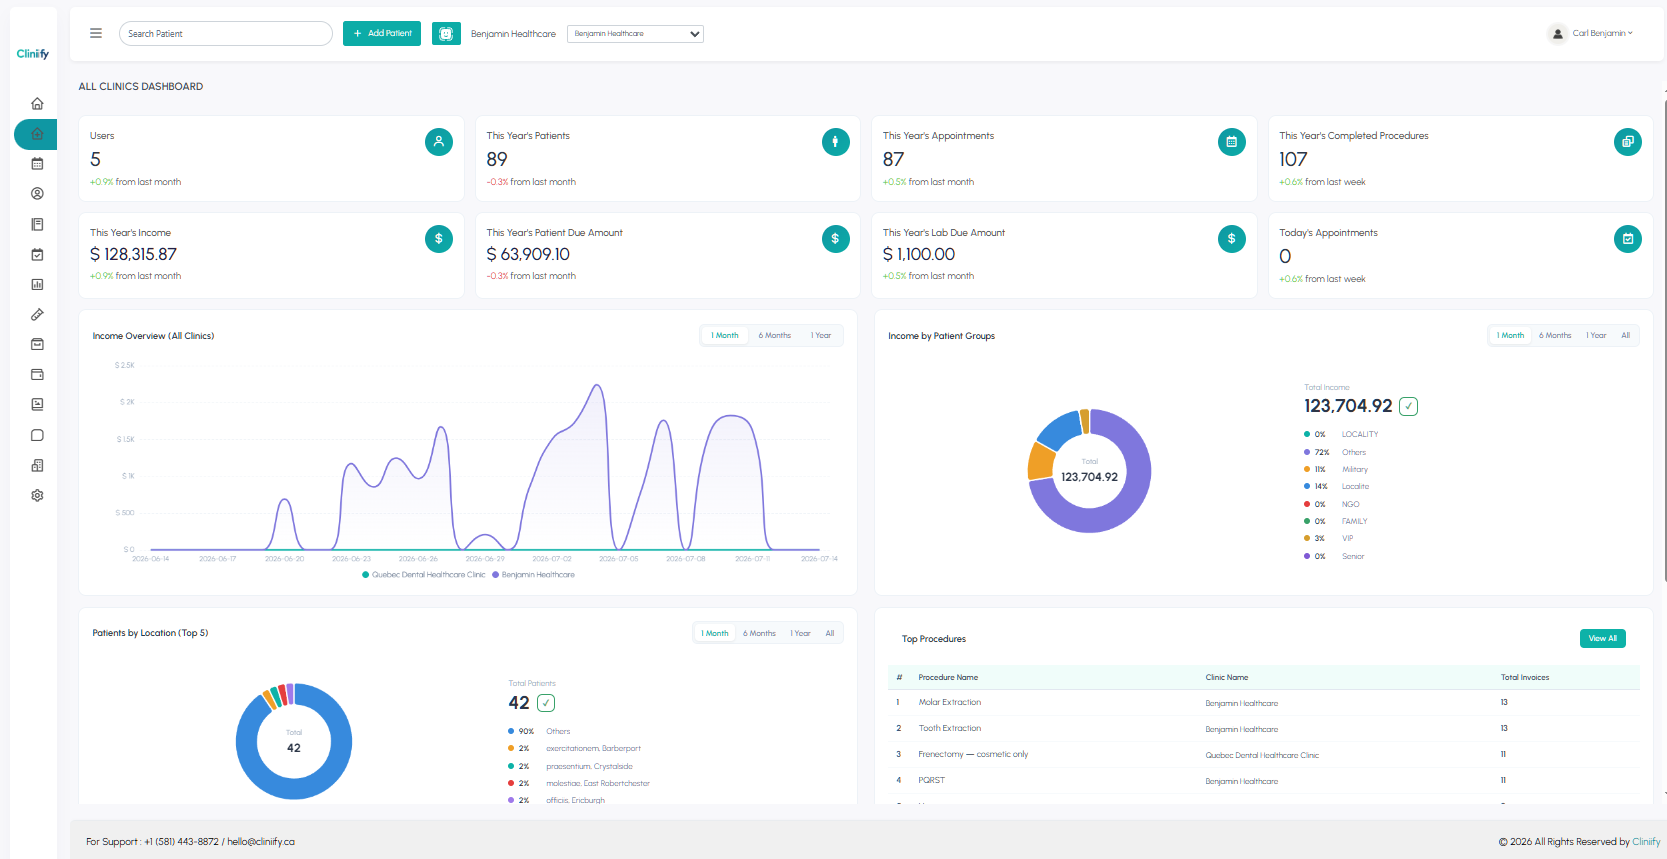
For dental groups and multi-location owners, Cliniify's All Clinics Dashboard consolidates performance across every location into a single view:
- Aggregate KPIs across all clinics — total patients (89), appointments (87), completed procedures (107), and income ($128,315.87) rolled up in one place
- Income Overview (All Clinics) — line chart comparing revenue trends across individual locations (e.g., Quebec Dental Healthcare Clinic vs. Benjamin Healthcare) side by side
- Income by Patient Groups — group-wide revenue breakdown by patient category with total income ($123,704.92)
- Patients by Location (Top 5) — cross-clinic patient geography for market planning
- Top Procedures by Clinic — procedure ranking with clinic attribution, so you can see which location is driving which treatment revenue
This means a clinic group owner can instantly see if one location is underperforming, which clinic is driving the most procedure revenue, and where patient volume is concentrated — without calling each location manager for a report.
CDCP & Insurance Billing Visibility
For Canadian clinics navigating CDCP claims, Cliniify surfaces outstanding patient due amounts and lab dues directly on the dashboard — so billing gaps are visible before they become revenue leaks.
Top Procedures Tracking
Know exactly which procedures are generating the most invoices across your clinic or group. Use this to inform scheduling priorities, staff allocation, and marketing focus.
What This Looks Like in Practice
Imagine starting your Monday morning and, instead of emailing your office manager for last week's numbers, you open Cliniify and see:
-
Single clinic owner:
- This year's income: $79,219.80 (+0.9% from last month — on track)
- Patient due amount: $65,059.10 (flag for billing follow-up)
- Top procedure this month: Tooth Extraction — 25 invoices
- Today's appointments: 0 (check scheduling for the week)
- Income trend: bar chart shows a revenue spike last week — what drove it?
-
Multi-location group owner:
- Combined income across all clinics: $128,315.87
- Quebec Dental Healthcare Clinic vs. Benjamin Healthcare revenue — line chart shows which location is pulling ahead
- Top procedure by clinic: Molar Extraction leading at Benjamin Healthcare (13 invoices)
- Patient due amount across group: $63,909.10 — which clinic is carrying most of the outstanding balance?
In 10 minutes, you know exactly where to focus your attention. No spreadsheets. No waiting for reports. No guessing.
That's the difference Cliniify makes.
Future of AI in Canadian Dental Clinics
The future of Canadian dental healthcare will continue to be shaped by AI and automation technologies.
Emerging innovations may include:
- Predictive patient analytics
- AI-powered treatment planning
- Automated workflow optimization
- Voice-assisted documentation
- Remote consultations and teledentistry
As patient expectations continue to evolve, clinics that adopt modern technology early will gain a competitive advantage.
AI-driven platforms like Cliniify are helping dental clinics prepare for this future by providing scalable and intelligent management solutions.
Conclusion
The most successful dental clinics don't rely on intuition—they rely on data. By tracking essential metrics like revenue, collections, case acceptance, patient retention dental clinic performance, no-show rates, and chair productivity, you can identify opportunities, reduce revenue leakage, and make informed decisions that drive long-term growth.
Instead of juggling multiple systems and spreadsheets, Cliniify brings everything together in a powerful dental clinic analytics dashboard designed specifically for Canadian practices. As a modern dental practice management software Canada solution, it helps you monitor clinic performance, streamline operations, and simplify dental revenue tracking in real time. Whether you operate a single clinic or manage multiple locations, Cliniify gives you complete visibility into your business with one centralized platform.
Ready to See Your Clinic's Performance in One Place?
Stop piecing together your clinic data from spreadsheets and disconnected software. Cliniify gives Canadian dental clinics a single source of truth for every metric that matters.
Book a Free Demo of Cliniify → www.cliniify.ca
FAQ - Frequently ask questions?
- How to Track Dental Clinic Revenue, Retention & KPIs | Cliniify
- Why KPI Tracking Matters More Than Ever for Canadian Dental Clinics
- The 7 KPIs Every Canadian Dental Clinic Must Track
- The Problem: Most Clinics Track KPIs Across Multiple Tools
- How Cliniify Solves This: One Dashboard, Every KPI
- Single Clinic Dashboard
- Multi-Clinic Dashboard
- CDCP & Insurance Billing Visibility
- Top Procedures Tracking
- What This Looks Like in Practice
- Why Canadian Dental Clinics Choose Cliniify
- Conclusion
- FAQs